Categories
Client Projects

Enye

Hey Guys,

Today I’m going to be demoing a template-based WordPress site here. So let’s check it out. 

(refreshes page, numbers roll and eventually stop, highlights Engineering and Founders programs)

This is a 501C3 nonprofit. It’s an international tech charity. They have two main aspects here. It’s the Engineering program and the Founders program. 

(scrolls down to the bottom of page, shows it is an 8-week course)

So what they do is they train engineers in Africa, specifically Nigeria during an eight-week course, and during that eight-week course. They learn a bunch of skills related to programming, deliver a bunch of features in an entrepreneur’s web application. So essentially it pairs them together and then by the end of it there should be an MVP app. 

(goes towards the bottom of page, highlights interactivity and animations)

As you can see there is a lot of pre-built interactivity that comes up, a lot of animations and templates are a really great value for a business owner or someone who wants to get an 80% done website and just load in some content. 

(scrolling up and down, comes upon a picture of self)

There’s a lot that you can do with it, they are pre-built out. The one downside is they can be kind of heavy as far as load times because there is so much included in them, but if we check out this site a bit more, we can see surprise surprise! I actually helped start this charity, but I just want to go through and show some pages and things like that. Let’s check it out. 

(screen changes to page with cards and photos of team members)

So I have these cards that are in here and then you have these hover-links that you can go through. This card style is something that is throughout the template. These are essentially components, WordPress components, and you can see that throughout.

(selects Partners, continues explaining as he pages around)

Let’s find another one, Say Partners for example. You can see that it’s a good look I think. I think it works. But I just wanted to demo this guys, because there is a lot of potential for business owners here to be successful using just a template-based website. It allows for a lower budget overall. I think it’s good to start with the templates a lot of the time and then go from there because building out from scratch takes so long unless you have a really custom build on the foundation, it makes sense to use a template as a base and just change things up, optimize it, things like that. 

(hovers over web address)

So just check it out. If you want to see this website it’s enye.tech. Also if you want to hire any of these remote engineers, they have very good rates, naturally, being in Nigeria. So if you are into international workforces, kind of like, off-shore international. This may be a good option if you are able to provide oversight and management and allow them to grow on your team. 

(brings back to the main page)

So cool! Alright, guys that’s pretty much it and all I have to say is check out some template-based websites because they are a fantastic value for the dollar amount. For anyone starting a business, that is needed. Just hire a web developer, get a template in, get them to do some customizations. 

And what is Chris saying? Ahh, I don’t know but I think we were having a funny conversation about something. Close that out. Alright guys, have a good one. Bye.

Categories
Client Projects Featured

Strain Connect

Hi Guys, 

Today I’m going to be demoing an old screencap of an applicable prototype for a startup called Stain Connect. Strain Connect was a cannabis recommendation engine for branded, lab-tested cannabis products. Let’s check it out.

(filling out login)

I built this with View and View X. Nowadays I’m a React guy and I probably wouldn’t go back to View, especially with View X. I really don’t like that state management. There are some good things about it, but there are also a lot of gotchas that you avoid in React and Redux. 

(cursor hovers over features as he explains)

So, as you can see there’s a couple of user-submitted choices here. The App revolves around 3 data points. Those three data points are then mapped to a Cartesian coordinate system that’s in 3D, along three axes, and then based on that it’s able to recommend products, kind of your standard data modeling recommendation engine. As you can see here are some products. 

(showing Admin Dashboard)

Part of the clickable prototype was the admin dashboard, where you could enter the products with the lab data, sorted by brand and then you as well could have a user dashboard. You will see near the end there, there were no users in this video, but you were still able to edit them. 

Something like this is really helpful for startups or people just developing concepts. Sometimes it’s a lot easier to spend $1000 to $1500 bucks and build out an idea and then iterate upon it for your business, rather than spending $5000 or $10,000 and then realizing, later on, that “Oh, this really wasn’t that great an idea”.  Sometimes those “iterable” prototypes are really helpful and I do recommend if you are a startup, creating one of those vs. just relying solely on a pitch deck is very helpful. This was a progressive web app to potential investors who could put it on their phones as well.

Categories
Featured Our Software

3D Earthquake Visualizer

Hey guys,

Today I’m going to be talking about 3D data visualizations using Three.js, React, data feeds from the USGS and progressive web applications. I think progressive web applications are a huge thing potentially for businesses that want to have a high return on an initial investment because you can deploy it to the web and also playstores. I’m going to show you that right now actually.

(clicks on another window)

So, firstly let’s check out the data feed. Here it is. This is the USGS (United States Geological Service).

(moves cursor to the bottom right column, clicks through to data)

They have data feeds on the side here…we click through, this is the maximum, all the earthquakes in the past 30 days. You can see how long that took. It’s a massive amount of data actually that comes through the scroll bar, so…so small there.

(power scrolls)

You can even see that in scrolling on my screen, if I scroll fast enough down, I don’t know, it kind of janks up sometimes.

(switches back to prior screen)

The interesting thing about this was, in doing this I actually noticed a bug in the USGS’s API, when the 30 Days, All Earthquakes count grew to be too great, I believe it was when it was over 15,000 or 20,000, something like that. When the data set was too long it actually would just error out. The whole API for that went down. I had to contact the USGS myself and have them fix that. So they just raised the limit for my request. So if you end up using these API’s and you specifically need the All Earthquakes, for the 30 Days, and it gets really high one month…you’re welcome. Haha! Thanks, also to the USGS for providing these fantastic data sets and fixing that.

(clicks on another window)

Let’s jump over to the Google playstore. As you can see, this is a progressive web app. Which means that I’ve gone and built it on a website. Right, it’s web-code, it’s HTML, CSS, Javascript, Frameworks, of course, React, Three.js. But the cool thing about this is you can build it in one language and deploy it across multiple platforms. Very great for business return on investment, fantastic for MVPing. Very great for early-stage startups and testing things out, because you only really need one set of developers. Good luck finding someone who knows how to write Native, Objective C, and Java, and Javascript. It gets a little intense having to manage all these people. So it’s a great way to start out.

(switches back to app)

So, let’s jump over to the app. I want to talk about some of the technical implementations I’ve put in here, that were essentially non-standard, I wasn’t expecting. So, this is built with Three.js. The data sets are so large that if you put this on the client-side, like on a phone for example it’s going to crash the browser in the phone. It’s just going to take it down. It doesn’t matter if you are on an old phone, a new phone, an iphone…it doesn’t matter. It’s just too much data, it’s difficult to do. So in doing the UI, I really wanted to keep it simple, I didn’t want to put in React components, I wanted simple HTML, and that’s what we got here, because the actual visualization and the data is so intense that I wanted to keep everything else really simple.

I put in a custom API for estimating download times. I take that GeoJSON set in the back end, I run some cron jobs and I convert it into Three.js, JSON on the server-side, which is not very often done. So, I’m one of the few people who have done that because I had to go through a bunch of…I had to surmount many problems in doing that because It’s not a typical use case. But we’ve gone and done that here, and it’s a fantastic experience.

So let’s check out the 30 days and jump in here. I built this project originally because I had met, now a good friend of mine in Thailand, from Nepal. His name was Mukti. There was a huge Nepali earthquake at the time. He brought people in from his village and housed them. Quite a lot of people in fact. I was so inspired that I really wanted to build this.

This is the application here.

(moves cursor over the left side bar, scrolls)

So, we have on the left side bar, all the earthquakes for the past month. There’s the location search. There’s list virtualization here. If you had that many in the list it would jank up, it would be a terrible experience. But what it does is it only render this 15 or 20 out of the entire set, dynamically and removes them when they are out of view. Which is great.

(selects physical globe from right sidebar)

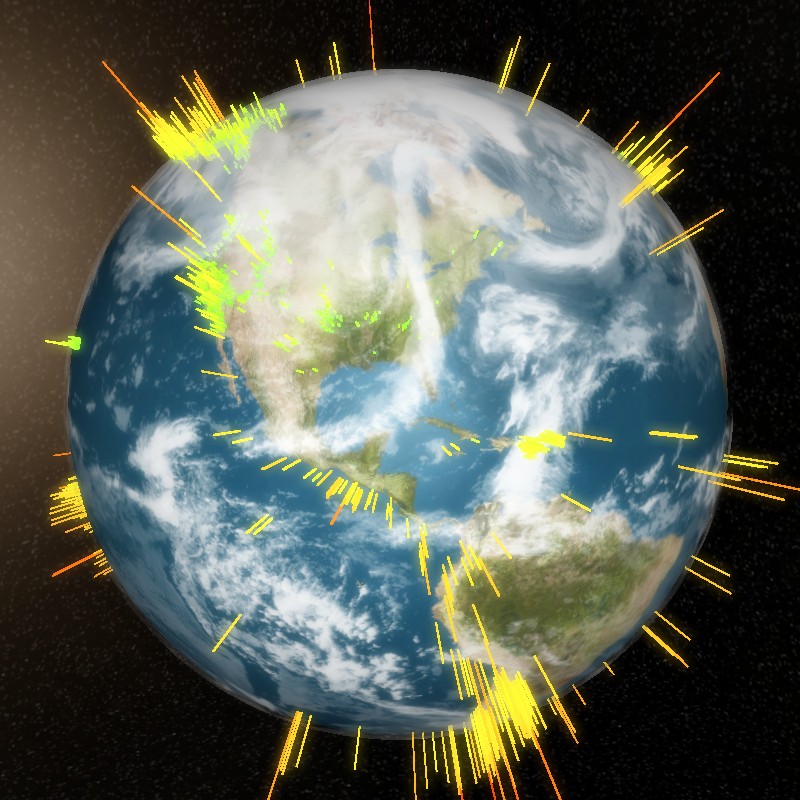
So let’s check out some of the different textures I have here. I have a physical globe. That removes the cloud layer. I got these images from NASA and compressed them a bit.

(selects Political Globe from right sidebar)

If I go into the political globe it switches over, and you have a very bright white outline of the borders, and you can really see the coloring. The way the coloring demonstrates visually the intensity of the earthquake is if it is green and small, it is a short earthquake. If it’s a long, lengthy point, like this one over here, Woooh! That’s a big one.

(selects Tectonic Globe)

Alright, let’s check out the tectonic globe, which is a really cool globe texture I made in Photoshop, and then mapped to this 3D sphere. It’s great for education to show people that a lot of these earthquakes happen right along the tectonic plates. Super cool, great visualization I think.

(selects Physical Globe, clicks on Auto-rotation)

So let’s bump it back to the physical globe. You can see there is auto-rotation. Very calm auto-rotation, you can pop it on and off.

(hovers cursor over data sets on right sidebar)

And then there are the different data sets here. So once you download the 30-day data set, you get access to all the smaller data sets. If you just downloaded in the past hour, these are essentially grayed out and inaccessible.

This entire UI works on a phone, so the way it works is these selections are on the bottom, you are able to click and this will drop down from the top. It will replace the entire view, you click on this and then it will hide it and it will rotate to the location. You can zoom in and pan on the phone as well. I’m just doing the desktop because the video would be too long if I did it otherwise. Feel free to check it out. Specifically tested this in Chrome in an Android browser. There were some issues on Mac and Safari with the texture loader, I may have gone and fixed that, but I primarily develop on Windows or Linux.

(selects Past Hour on right sidebar, then Past 24, finally Past Week)

So let’s check this out. In the past hour only eight. So small, these earthquakes. In the past 24 hours, 280. Pat week, almost 2,500. Very cool stuff here, guys.

(Chooses 30 Days, then enters California in the search field)

Let’s check out the 30 Days, and let’s test out the search functionality. So if we type in California here, and do the search, it pops over, and this overlay comes out of nowhere on the left, and replaces it. Now let’s click on this.

(chooses specific location from the list)

So BOOM, you have zooming and panning to the location. You have this small sphere.

(switches to the Political Globe)

Let’s go over to the political globe, you can see it a little better. You see that there? You can. In the larger earthquakes, it’s a larger sphere. But it was a fun project that I enjoyed doing. There was some learning involved with mapping coordinates to a 3D globe, so I actually learned about Cartesian systems, and coordinate systems and maps in general. It was a great experience.

So if your business is needing some Three.js and React work, or just a progressive web app where you can deploy this into a play store or a Google app store for a relatively lower amount of initial investment than hiring a separate code team for four different platforms. I hope this video helps demonstrate the value in that. If you want to talk more about this, about how this type of approach can benefit your business, please contact me. I really look forward to talking about how we can generate more revenue and better experiences for your customers.

Thank you and have a good one. Bye.

Categories
Client Projects

News Poll

Hi Guys, 

Today I’m going to be talking about News Poll. Which was a polling question software we ended up building for a client by the name of Lemuel Lewis. He had a third party solution going on, but he wanted his own because sometimes the original would go down. 

He had this whole conglomerate of websites, literally hundreds and hundreds of websites, of which he was generating a bit of revenue on each from advertising. So this was one of the kinds of gimmicks that would generate people to come vote. It was a thing that he would integrate into a lot of these websites. So there was a client-side script and an admin panel. There were six requirements in this project. 

  1. Create new poll-in questions with an admin panel. 
  2. Each one needs its own unique color.
  3. You’d have to see the results nationwide while hovering on a state. 
  4. Allowing a client-side script that would be deploy-able on hundreds of other websites.
  5. Preventing users from submitting multiple votes.
  6. Allow for pulling of old news poll data, like CSV. 

So let’s check out the video. 

(starts filling in fields)

Okay, so this is the basic admin panel that we put in here. When you click through here you’ll be able to see. 

(clicks through to a map of the United States)

Yeah, so what we’ve gone and done is we have the visual representation of what a person would see on the website after they vote. So it’s an exact duplicate except the client-side script doesn’t use UX. So that one is just straight Javascript, and then this has an actual framework, but I like this because there is 2-way data binding, as you can see. 

(enters question into field)

So if you put that question in and save it, it will update, and then because of how the client-side scripts are fashioned it will update across every single script. 

(highlights the styles)

The styles are injected with a function vs. including them. So you won’t have to actually upload another file to all these websites. As you can see, you just save tee poll question 

(switches to CSV data box)

and then there is also going to the CSV data, where you can pull up old votes and just copy them out.

(hit accept)

Just like that. 

(switches to client-side view in another browser window)

Okay so if you jump over here is the client-side view. Then there is when you click through. That’s the old question and you refresh, 

(refreshes screen)

and then you can see that’s it’s updated with the new question that we just saved. And if you refresh on this one you will see the new result here. 

(new results appear with refresh)

So, let’s see if we refresh because you just voted… and there you go. When we deploy this onto the servers you click through and it changes. I’ve just set this up for demonstration purposes so you can see. But yeah, it was a fun project. It’s always great to have more experience in D3 and a little more experience in View, so if you need infographic or any sort of data visualization for you business we can solve that problem very well for you. Thank you. Bye.


Categories
Our Software

Wordza

Wordza was a web application I built with Vue.js + Vuex after having traveled around Ukraine for over a month. I’ve always had an interest in the Russian language since I was a child. I found the Cyrillic alphabet fascinating with it’s classic communistic block typeface and similar looking characters to the Latin alphabet. In my travels I realized that if I knew English, Spanish, and Russian that I would be able to speak to someone almost anywhere in the world.

With that ideal in mind, I began searching for language learning software! I soon found out that if you know the 1,000 most commonly used words in a language you can roughly understand the gist of 60% of what is said. This was a powerful concept in my mind. I would seek to learn the top 1,000 most commonly used words followed by grammar and natural conversation practice.

I was unable to find flashcard software that suited my three basic criteria:

  1. Allow for my own custom submitted word lists in addition to containing the top 1,000 most commonly spoken words.
  2. Automatic speech of the word or phrase by a native language sounding speaker via text to speech (TTS).
  3. Speech recognition of my spoken word and matching of my pronunciation with that of the text to speech.

With that discovery, Wordza: Language Flashcards was born!

I was pleasantly surprised to learn that some browsers, at the time of writing Chrome and Android browser, supported text to speech and speech recognition in the Web Speech API.

Text to speech functionality plays off this…

[code]
playTTS() {
let utterance = new SpeechSynthesisUtterance(this.$store.getters.currentWord);
utterance.lang = this.$store.getters.currentLang;
utterance.voice = speechSynthesis.getVoices()[18]; // Russian Voice
speechSynthesis.speak(utterance);
},
[/code]

While speech recognition is like this…

[code]
recordAudio() {
// Reset Match Status
this.recording = true;
this.speechMatch = null;
this.speechWord = “…”;

window.SpeechRecognition = window.webkitSpeechRecognition || window.SpeechRecognition;

this.recognition = new SpeechRecognition();
this.recognition.lang = this.$store.getters.currentLang;
this.recognition.interimResults = false;
this.recognition.maxAlternatives = 1;
this.recognition.start();

this.recognition.onresult = (event) => {
const word = event.results[0][0].transcript;
this.speechWord = word;
this.recording = false;

if (word === that.$store.getters.currentWord) {
this.speechMatch = true;
this.playCorrectBeep();
} else {
this.speechMatch = false;
this.playIncorrectBeep();
}
}
},
[/code]

Post in progress come back later!